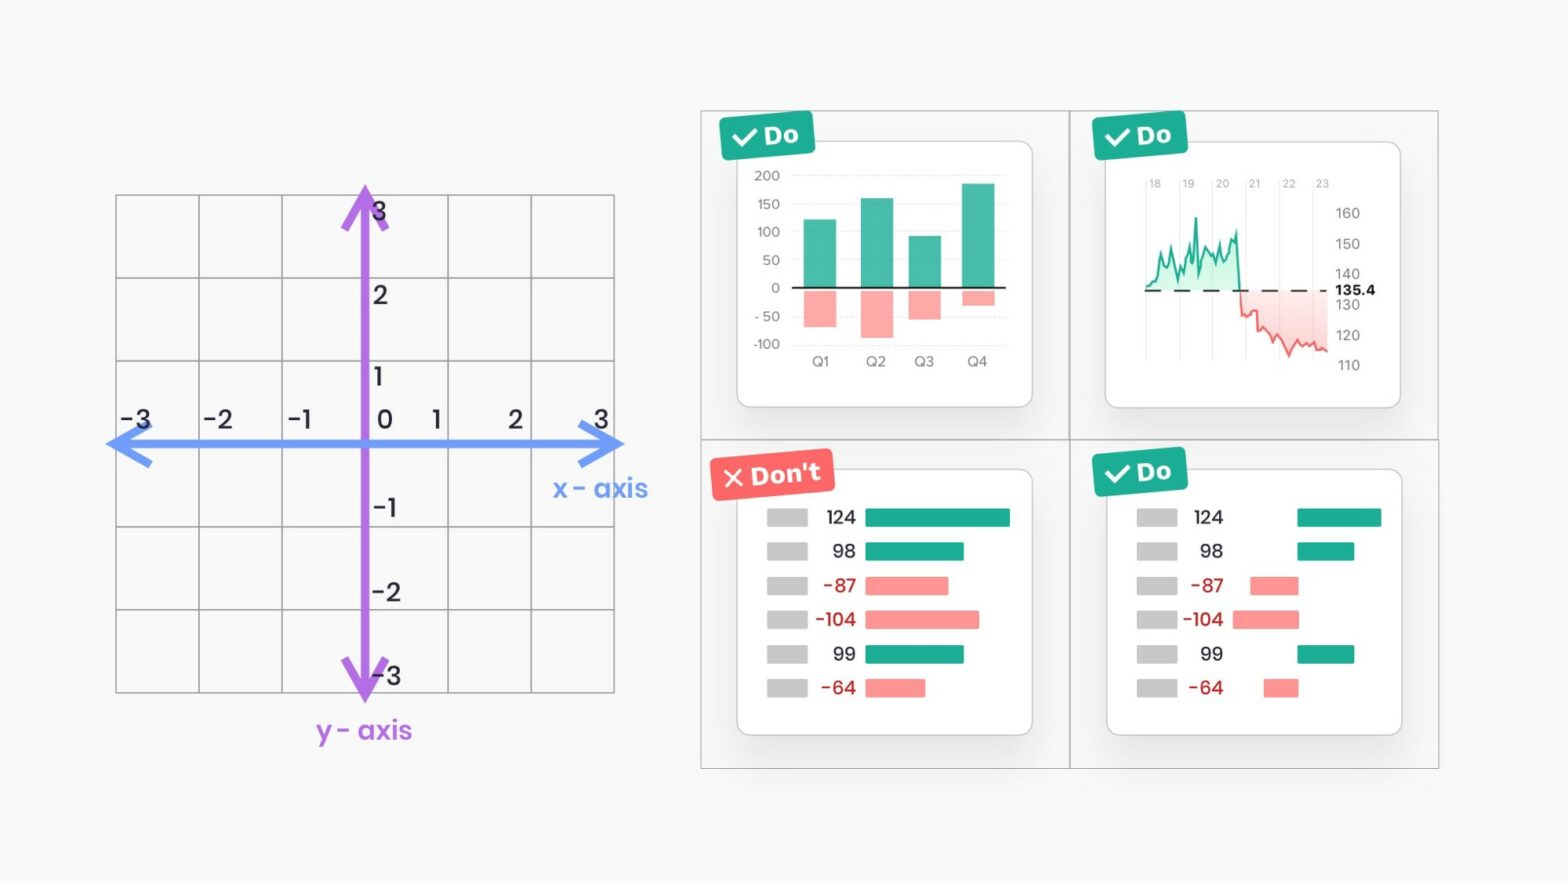
Applications we design are becoming increasingly data-driven. The need for quality data visualization is high as ever. Confusing and misleading graphics are all around us, but we can change this by following these simple rules. I found these tips very snackable and on-point. Don’t entirely agree with “4. Use adaptive y-axis scale for line charts”, …
Tag Archives: charts
mermaid – Generation of diagram and flowchart from text in a similar manner as markdown
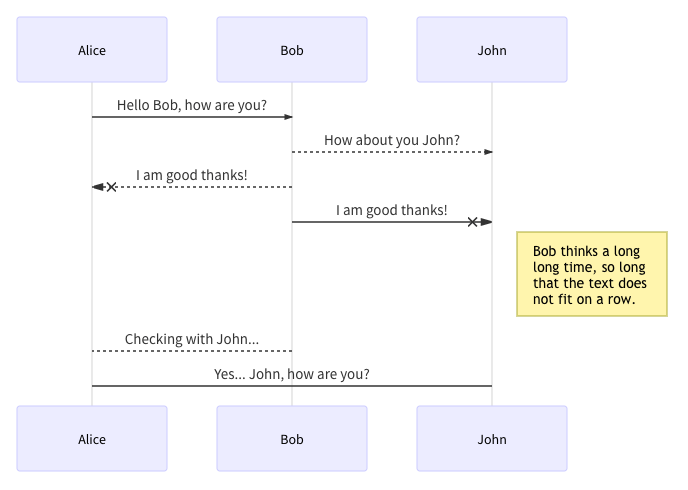
Markdownish syntax for generating flowcharts, sequence diagrams, class diagrams, gantt charts and git graphs. The code for the sequence diagram at the top is this: sequenceDiagram Alice ->> Bob: Hello Bob, how are you? Bob–>>John: How about you John? Bob–x Alice: I am good thanks! Bob-x John: I am good thanks! Note right of John: …